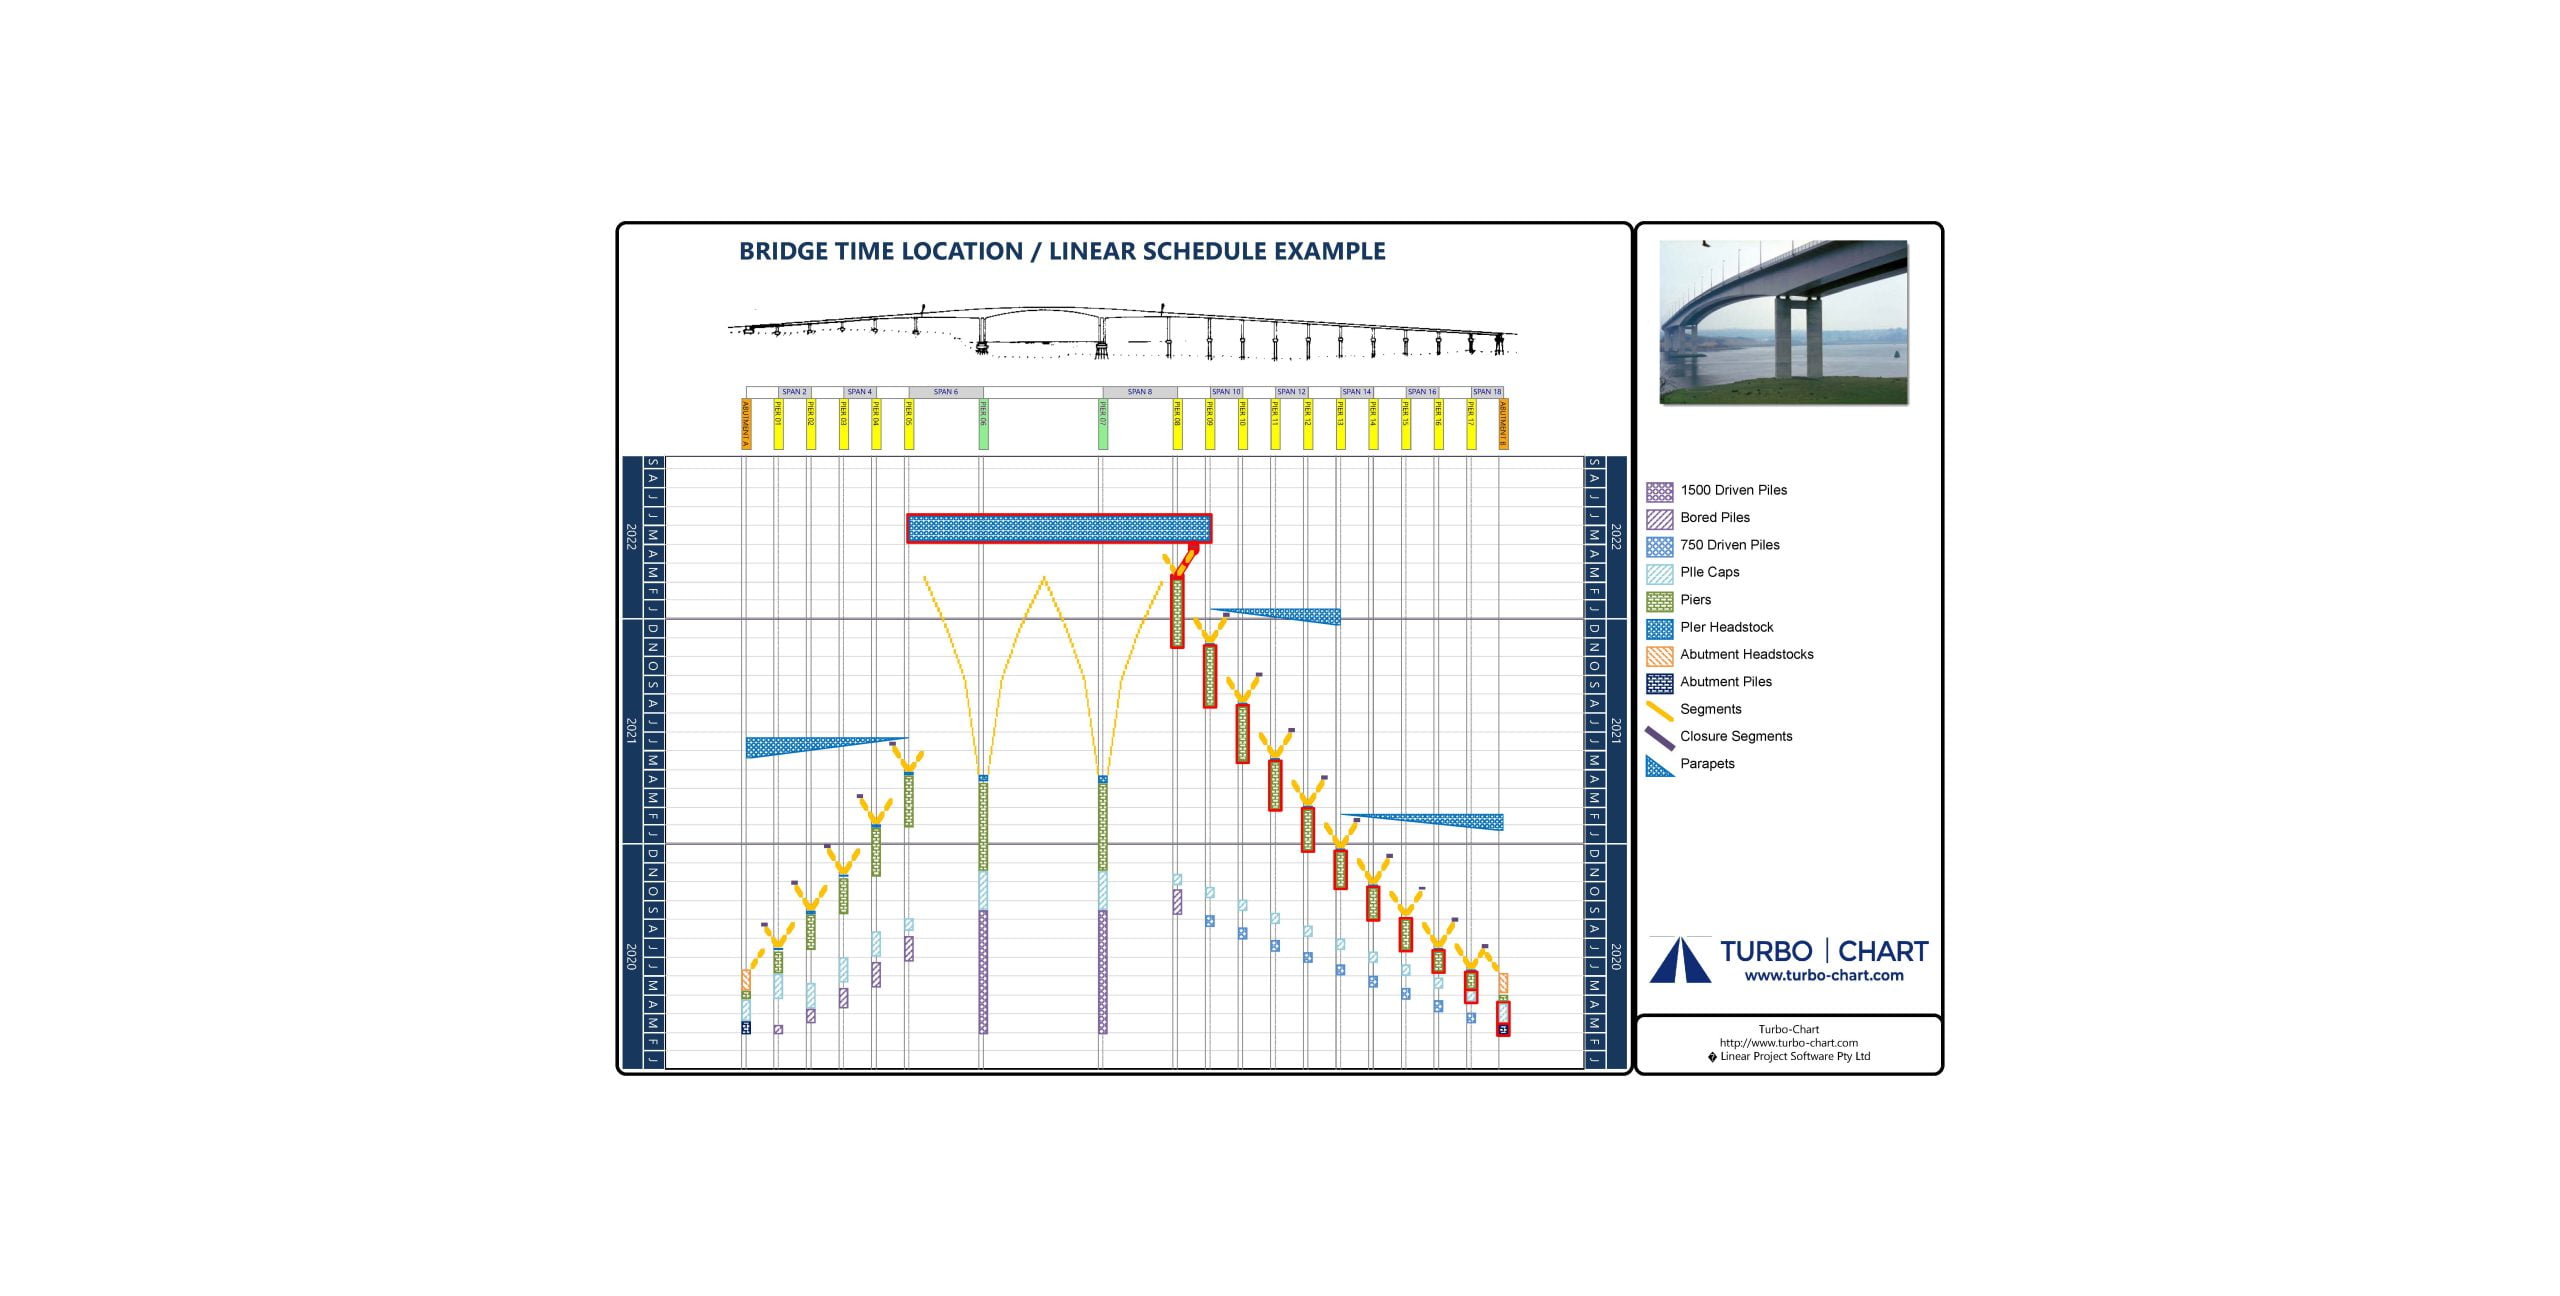
logo

Turbo-Chart

Turbo-Chart

An easy and fast way to create Time-Location Charts and linear Schedules for linear projects

Play Video about Linear scheduling by Turbo Chart

Features:

Cost Effective

Turbo-Chart is significantly cheaper than alternative tools, and does not require extensive time and effort in training.

Instantly Update and Compare Schedules

Direct connection to scheduling tools such as Primavera P6, MS Project, Asta PowerProject, and Safran.
Import any spreadsheet data using Paste Wizard.
As your schedule changes, Turbo-Chart updates your charts in seconds and lets you compare schedules.

Quick to Learn

Learning Turbo-Chart is measured in hours, not days, weeks or months, as alternative methods require.

Avoid Duplication and Integration Issues

Turbo-Chart works with your schedule data, avoids extracting to another tool requiring re-integration, maintaining a single source of schedule information.

Easy to Use

Produce charts directly from your schedule data without additional modules or complicated import processes.

Who can use Turbo-Chart?

Turbo-Chart can be used by executives of various stakeholders, such as sub-contractors, general contractors, consultants, and clients.

Project Schedulers:

Time-Location charts help the project schedulers visualize the project schedules on one page, making it easier to identify and prevent scheduling conflicts from a different perspective.

Project Coordinators and Managers:

Time-Location charts allow project coordinators and managers to monitor the contractors’ and subcontractors’ work efficiency readily.

Clients:

Turbo-Chart is an excellent tool for reporting linear projects to clients since the Time-Location charts are much easier to read and understand (compared to the Gantt charts)

Purchasing and Licensing:

PM ERA is an authorized Turbo-Chart partner for Canada. Contact us today for any sales, training, or support related questions.

14 Day Trial

$ 0 CAD
  • Trial
  • Full 14 day trial

Standard

Annual Licenses

$ 949 CAD
  • Single User
  • Billed Annually

Case Studies

Tutorials

Turbo-Chart Time Location Duration Uncertainty Schedule Risks

This video demonstrate the use of Time Location charts during a Monte Carlo Schedule Risk Analysis. This specific example shows the effect of duration uncertainty applied to sequences of linear works.

Turbo-Chart Time Location Discrete Schedule Risks

This video demonstrate the use of Time Location charts during a Monte Carlo Schedule Risk Analysis. This specific example shows the effect of duration uncertainty and Discrete Risks applied to sequences of linear works.

What are Time Location Charts

Watch our video for a brief overview of Time Location Charts, how they are used and how Turbo-Chart can help visualise your Linear Project Schedule

Turbo-Chart Quick Start Guide

A quick start guide to using Turbo-Chart, from preparing and importing data, viewing and modifying the chart and running comparisons between schedule versions

v1.3.2 Criticality Update

Our Recent v1.3.2 release features options for the display of critical schedule tasks. This video provides a brief overview of these options.

Turbo-Chart: Connection to Asta Powerproject

Demonstration of Connecting and updating Turbo-Chart to Asta Powerproject schedule

Turbo-Chart: GANNT VIDEO

This video demonstrates using Turbo-Chart to display or summarise schedules using Turbo-Chart linked to scheduling data.

Download, Install, and Activate Trial Version of Turbo-Chart

Watch this video to find out how to download, install and activate a trial of Turbo-Chart

P6 Copy and Paste Wizard

A how-to-guide on Copy from Primavera P6 Activity Layouts to Turbo-Chart using the Paste Wizard

User Guide & Manual

Turbo-Chart Knowledge Base

FAQ

General

  • What is Tubro-Chart?
    Turbo-Chart is a new tool for generating Time Location charts (also known as Linear Schedules or Time Distance/ Time Chainage Charts) that are used to visualize linear project schedules, directly from your preferred scheduling tools.
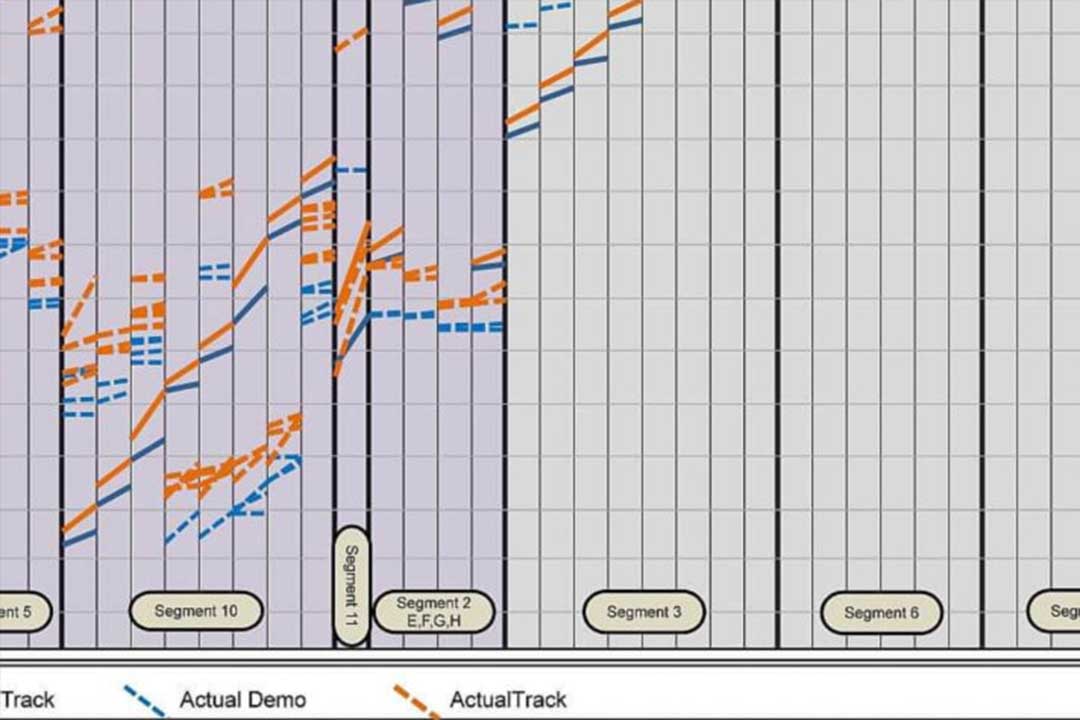
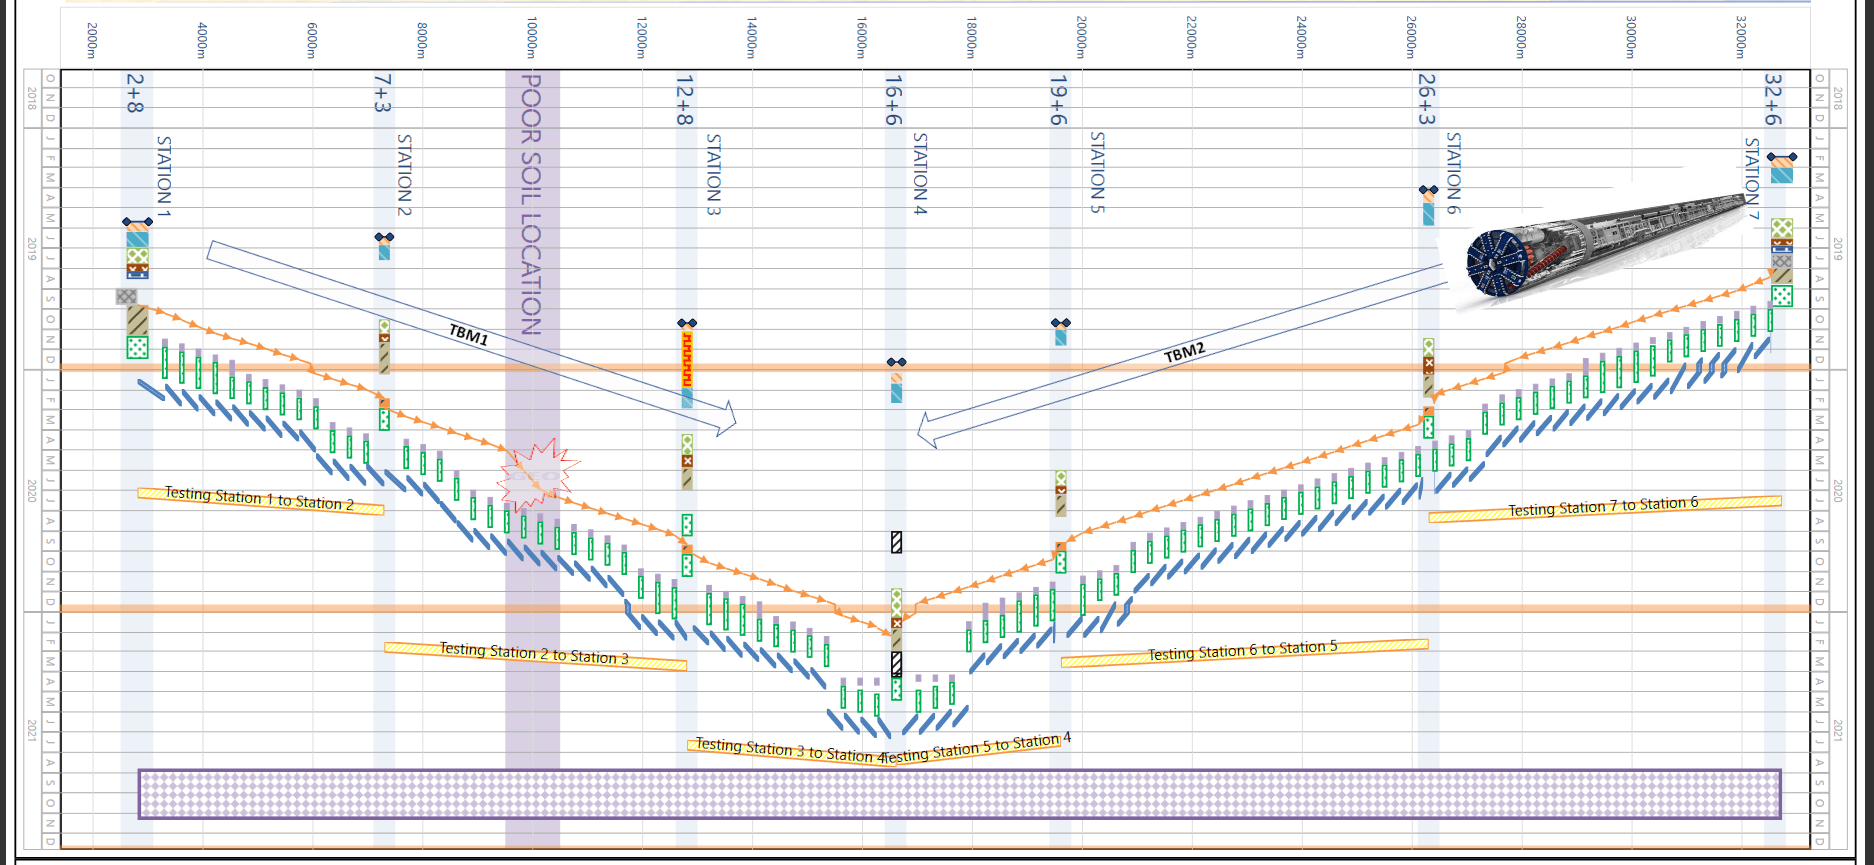
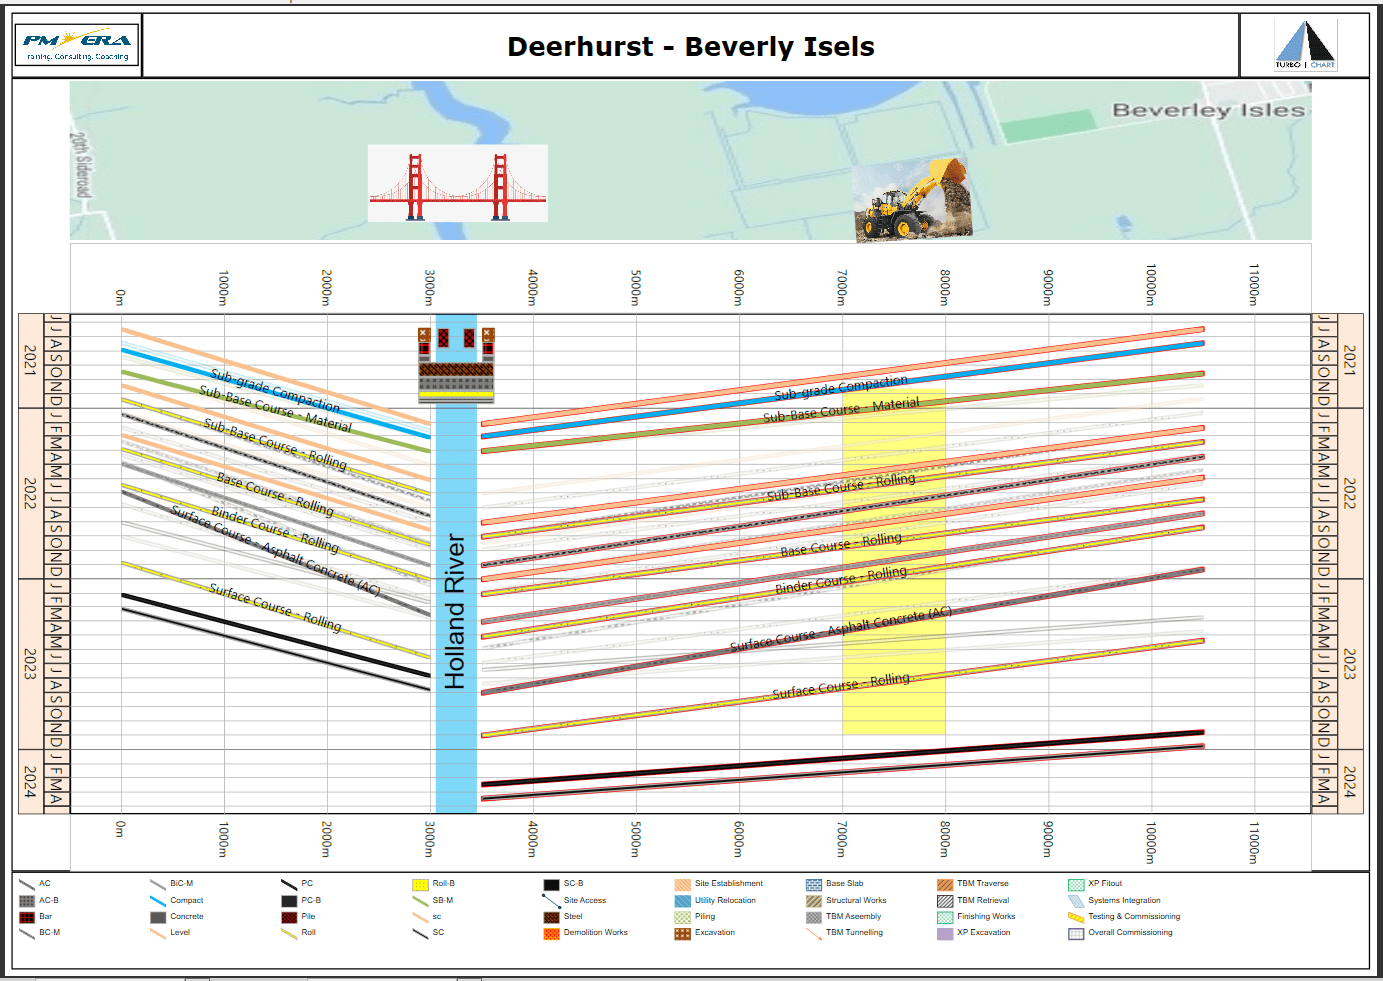
  • What is Time-Location Charts?
    Time Location charts are a way of visualizing project schedules representing the linear alignment of a project on one axis, and time on the other axis. Schedule activities are then plotted onto the chart according to the locations over which they occur and the dates that the project schedule determines. Different types of shapes, colors and patterns are used to represent the different type of work occurring. For more information, please see this video: https://www.youtube.com/watch?v=1sDK44oobyM
  • What Scheduling Tools Turbo-Chart Work With?
    Turbo-Chart can work with the following Scheduling Tools:
    • Primavera P6 Release 6+ SQL/SQLExpress/Oracle/Oracle XE by connecting to databases available from local P6 clients using privileged administrator passwords
    • Primavera P6 Release 15+ SQLite Databases
    • Primavera P6 Release 6+ EPPM databases using Webservices
    • Primavera P6 XER files (note XER files cannot be synchronized)
    • Microsoft Project 2010 / 2013 /2016 using *.MPP files
    • Safran Risk / Safran Project V7 onwards
    • Asta Powerproject v14+ *.PP files
    As well as the above products, Turbo-Chart will work with any data produced in tabular / spreadsheet format.
  • Does Turbo-Chart Create Project Schedules?
    While TurboChart can be used to create Project Tasks on a Time Location chart, Turbo-Chart does not contain a scheduling engine to generate traditional Critical Path Method analysis. We have intentionally chosen this for two reasons:
    • Our approach is that our users continue using Scheduling tools they prefer and are familiar with and are not required to spend significant time and effort in learning yet another Scheduling software tool
    • By not introducing scheduling capabilities, Turbo-Chart is quick to learn, easy to use and can operate fast!
  • How much does Turbo-Chart cost?
    We have our pricing and purchasing options listed, on our purchase page.
  • Can I get help using Turbo-Chart?
    We hope that Turbo Chart is easy to use, and we don’t expect it will require significant effort or training to use. If you still need help:
    • Tutorial videos and documentation will be available on our website and also on our YouTube Channel
    • Sample data is available within Turbo Chart from the HELP>DOWNLOAD SAMPLES menu
    • Support is available to subscribed customers through their purchasing partner or via email: support@pmera.com
    The latest User Guide is available from here If you still require customized training, please Contact Us for assistance
  • I have an idea for Turbo-Chart; What should I do?
    Within Turbo-Chart, there is a feedback form that can be accessed from the HELP>BUGS or SUGGESTIONS menu. You can also, always email us: support@pmera.com for purchasing, support, and maintenance of Turbo-Chart.

Purchasing, Support and Maintenance

  • How do I purchase Turbo-Chart?
    You may directly purchase single licenses from our Purchase page or contact us to arrange for quotations or offline purchases. If you require more licenses or want to receive discounts for bundles of licenses, contact us.
  • What do I receive as part of my subscription?
    When you purchase a Turbo-Chart subscription, you receive an activation code that allows you to use Turbo-Chart for the period of your subscription. While subscribed you will also receive updates to the software, and access to support through your purchasing partner or with Linear Project Software.
  • What happens to my Chart data if I do not subscribe or renew my subscription? Will my data be lost?
    If you do not subscribe or do not renew your subscription, you will not be able to launch Turbo-Chart or receive updates or receive support Regardless, your data is yours and stored locally on your machine. It is stored in an open standard (JSON) and can easily be decoded and used by other systems. No Turbo-Chart data (other than support related issues) are accessed or retained by Linear Project Software.
  • Can I install Turbo-Chart onto multiple PC’s under my registered account?
    If you have a valid subscription, you may install and activate Turbo-Chart on two unique machines for the same user using the license code provided after subscription  If you are interested in concurrent licensing options, please contact us.
  • Can I transfer my license to another user if it is no longer needed?
    While we do allow transfers of licenses when users leave an organization, we do not let licenses be swapped or exchanged to previous Turbo-Chart users. We can offer a network concurrent licenses for organizations that wish to allow multiple users to access licenses. Contact us or email us via support@pmera.com  for more information.
  • Do you offer Concurrent licensing?
    Yes we can, please Contact us or by email: support@pmera.com for more information.

Technical

  • Are there any minimum PC specs to use Turbo-Chart?
    You must have or be able to install .Net4.5  See Microsoft’s Website for more information: https://msdn.microsoft.com/en-us/library/8z6watww(v=vs.110).aspx 
  • Will Turbo-Chart work without an internet connection?
    Yes it will. BUT, without it you won’t get updates. When the installed license expires it will need to be refreshed via the internet (or over the phone).
  • Do I need Admin rights on my PC to install Turbo-Chart?
    You should not need full admin rights. We are using a technology called ClickOnce which should allow you to install without full permissions. More details here: https://msdn.microsoft.com/en-us/library/142dbbz4(v=vs.90).aspx There may be rare instances where there may be installation issues. As each PC configuration/ IT Dept. settings vary, your own support is best placed to assist with installation issues.
  • My organization uses Citrix to deploy P6; Can it still use Turbo-Chart?
    Yes! in fact we’ve created a Paste Wizard that makes copying from P6 to Turbo-Chart as quick and easy as directly connecting to a P6 Database. See our post here for more information.  P6 database connectivity to Turbo-Chart is available to users who have SQLite, SQL Servers and Oracle XE as local databases, or can access databases using P6 Web Services.  We are aware that many organizations deploy P6 via Citrix environments and we do intend to support such environments in the very near future. If your organization is able to assist in testing & development in such environments, we’d love to hear from you. 

Revolutionize Your Project Management

What is Business Intelligence in Projects?

We are committed to providing Business Intelligence services tailored to your existing systems, enhancing your project management experience through real-time insights, seamless integration, and informed decision-making.