Schedule Preparation
- Prepare schedule within P6
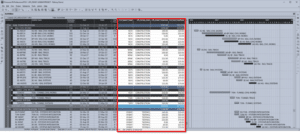
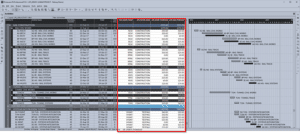
- Turbo-Chart requires three additional data fields, as User Defined Fields (UDFs) as listed below:
- Numeric UDF for location start value
- Numeric UDF for location end value
- Text UDF for Shape Code values
- Text UDF for Filter Code value (this field is not a required field, but can also be used)

- Assign values for location start and end points to schedule activities
- Assign Shape Codes to schedule activities. Turbo-Chart uses Shape Codes to define the displayed shape
- Assign Filter Codes to schedule activities (if required). Turbo-Chart can use Filter Codes to filter the displayed tasks

Import Data to Turbo-Chart
After opening Turbo-Chart, data from P6 can be imported by three methods:
- Direct Database connection (Applies to SQLite and SQLExpress Databases)
- Importing from XER files – Synchronization will not be possible
- Copy and Pasting spreadsheet data (Refer to separate article on “P6 Layouts and Spreadsheet Import”
Direct Database Connection
- Select FILE > PRIMAVERA > OPEN PRIMAVERA PROJECT
- From the Open Primavera Database Options Screen:
- Select the P6 Database to connect to in the upper section
- Select the P6 Project to connect to in the middle section
- Map the UDF data fields containing data in the lower section, and select OK
Note that enabling (ticking) the Ignore tasks with no value option, will only import Activities from P6 where the corresponding fields contain valid values, i.e. not null.

Import from XER Files
- Select FILE > PRIMAVERA > OPEN PRIMAVERA XER PROJECT
- Navigate to the directory location of the required XER file and select OPEN
- From the Open Primavera XER Options Screen:
- Select the P6 Project to import from in the upper section
- Map the UDF data fields containing data in the lower section

Customize the Time Location Chart
Turbo Chart Navigation
Turbo-Chart navigation consists of these main areas:
- Chart Grid – the main area that contains tasks, date axis and location axis
- Top Image – an inserted image to represent project location
- Legend – generated from Shape Codes (may be hidden if required, refer to chart options)
- Task Details – provides details for each displayed task, also visible via the PROJECT > TASKS menu
- Shape Code – provides details for each shape code, also visible via the PROJECT > SHAPE CODES menu

Customizing Tasks’ Shape Codes
All tasks are displayed by a corresponding Shape Code, with values that determines:
- The tasks shape – Lines, Rectangles or Parallels
- The Tasks colors, transparency, line thickness etc.
- Selection to display (or remove) the shape code in the legend for the selected chart
- Selection to display (or remove) all tasks with corresponding shape codes for the selected chart
Shape codes can be modified by any of the following:
- Clicking on the corresponding Shape Code in the legend area
- Selecting shape codes in the Shape Code area
- Viewing the Shape Code table via the PROJECT> SHAPE CODES menu
- Entering a new Shape Code value in the Task Details area (will copy the existing Shape Code Values)
Shape codes can also be saved and loaded as Shape Code Library *.tcib files

Customizing Tasks’ Details
Tasks details are initially imported from source schedule data but can be modified by any of the following:
- Clicking on the corresponding Task and modifying values in the task details area
- Click and dragging the activity on the Chart Grid using the ‘crosshairs’. Allow Tasks to be dragged must be enabled in the EDIT menu
- Viewing the Task table via the PROJECT> TASKS This table can also be used to copy task details from Turbo Chart or imported into Turbo Chart in Spreadsheet format.
- New Activities can also be generated from the Task Table
- New Activities can be created on the Chart Grid directly using the ‘crosshairs’ if Allow Tasks to be created is enabled in the EDIT
Any Task details that vary from imported values are highlighted in the Task Details area and in the Tasks Table.

Filtering Displayed Tasks
If Filter Code values were imported, Turbo Chart can select these values to display or remove tasks from the Chart Grid. Select PROJECT > FILTERS from the menu to view the Filters Screen.

View Options
Additional Customization of the Chart is possible from the VIEW menu:
- Top Image lets a graphic file (*.png or *.jpg) be inserted at the top of the chart. The image will automatically be sized horizontally to fit the location axis. A Top Image can also be added by double-clicking on the Top Image area on the chart.
- Show Date 1/2/3 allows display of multiple date fields for Tasks
- Show Legend: displays or hides the Legend Area
- Fit to Screen: fits the entire chart onto the viewable area or expands out to full size
- Best Fit: automatically adjusts time and location axes to fit the Task data
- View Options, allows further customization of chart details including the location axis and date axis ranges


Synchronize with Schedule Updates
As the project is updated, Turbo-Chart can easily update the Time Location chart, by synchronizing data
Synchronizing with a P6 Database
If connected directly to a P6 database, select the Data to be synchronized from the FILE > SYNC OPTIONS menu.
Any synchronization will match Task Name (Activity ID), i.e. any changes in P6 to a specified activity, will synchronize the P6 value to Turbo Chart To Synchronize, select FILE > RE-SYNC FROM SOURCE from the menu.

Synchronizing using Spreadsheet data
Project Activity Data can also be imported by Copy and Pasting activity data from Primavera P6 under the following conditions:
- Column headings for the P6 data fields must match those used in Turbo Chart as shown below
- No Grouping and Sorting is to be applied to the data copied from P6
- Pasting into Turbo Chart Task Table will update values where Task Name/Activity ID match, or new tasks will be generated

Saving Turbo Chart Files
Turbo Chart can save all data in *.tcproj format. This data file contains all information used to produce the Time Location Chart, including the Task and Shape Code Library data and the attached Top Image
Further Help
Should you need further help regarding Turbo-Chart, we are here to support you!
Just send an email to support@pmerasupport.com


